Home > Kaluza C

Beckman Coulter has launched a unique data analysis system for the clinical laboratory, the Kaluza C Flow Cytometry Analysis Software. Having been listed with the FDA and CE-IVD approval, it streamlines clinical QC reporting and addresses standardization issues in flow cytometry.
Kaluza C incorporates quality control visualization tools and IVD registration for regulatory and quality control compliance. The software also offers a range of user management tools, from report page generation to auditing work levels and traceability, and enables easy exporting of data into the main laboratory information system as standard.
Kaluza C Flow Cytometry Analysis Software is built upon our successful Kaluza Analysis research use platform. We’ve turned our attention now to the unique needs and challenges of the clinical flow cytometry laboratory.
Clinical laboratories are under increasing pressure from three sources: reimbursement, regulatory, and resource. Meeting regulatory requirements places demands on both time and expertise. Kaluza C provides features that streamline the clinical QC reporting requirements and address standardization issues in flow cytometry. At the same time, it provides the power to processes multi-color files of up to 20 million events in real time.
Fill out the form and download a risk free 30-day trial. Take advantage of the online tutorials and receive tips and tricks via email. If you would like to continue using Kaluza Clinical Analysis software after that, contact your sales representative or order a copy of Kaluza Clinical online.
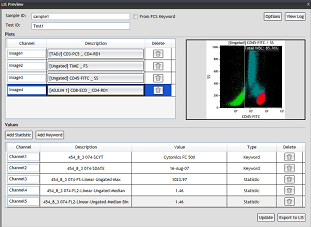
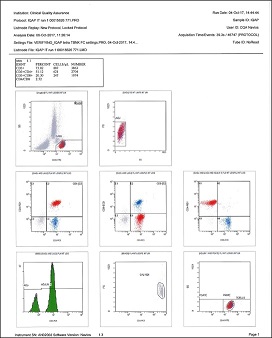
Create and edit a Report Sheet, which can include plots, tables, graphics, text, page numbers, and/or a date and time stamp. Quickly arrange plots so that they do not overlap, or align them to the location of your choice. An electronic approval signature can be added to the report sheet. Kaluza C includes an interface that enables the transmission of results, including plots, related statistics, and keywords, to a Laboratory Information System (LIS).
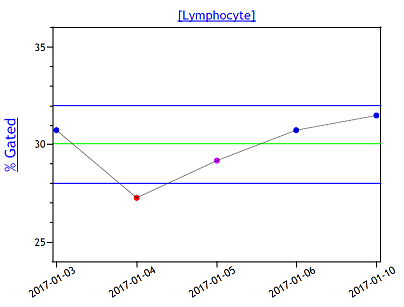
(QC Reports) are designed to help you detect issues that could produce inaccurate results in your data analyses, such as problems with the flow cytometer optics, instrument calibration, reagents, etc. Through the QC Report Activity tab, Kaluza C provides a platform to allow you to create Levey-Jennings plots, which clearly show whether data collected from control samples are either inside or outside of the standard accepted values. A QC Report is made up of one QC Protocol (*.protocol or *.qcp) and multiple Data Sets, which can be saved as one QC Report file (*.qcr).
User Management controls the level of access of each account set up on the system. There are two types of accounts available in Kaluza C, the Operator and the Administrator accounts. The Administrator account oversees account setup functions and can review the activities for all accounts on the system.
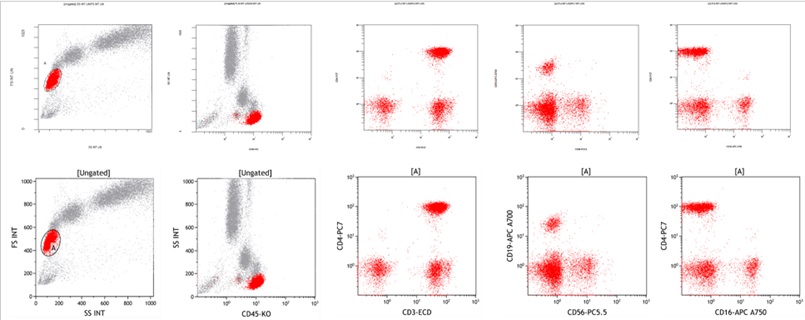
Kaluza C uses the FCS $CYT keyword to identify the flow cytometer used in acquisition. Data scaling preferences for the instrument are set up once upon loading the file into Kaluza.
The example shows Navios data using Navios System Software (top row) and after importing into Kaluza Analysis (bottom row). Scatter and fluorescence parameters scaling are identical.
Presented plots and values are for illustrative purposes only and are based on customer reported data. Some information has been modified to simplify the presentation. Individual results may vary.

For In Vitro Diagnostic Use. CE marked to the European In Vitro Diagnostic Medical Device Directive 98/79/EC.
© 2017 Beckman Coulter, Inc. All rights reserved. Beckman Coulter, the stylized logo, and the Beckman Coulter product and service marks used herein are trademarks or registered trademarks of Beckman Coulter, Inc. in the United States and other countries.
FLOW-09.177